
{{status_msg}}
Q4 2024 Preliminary Trend Announcement



January 3, 2025 • An Analysis by Thomas LaSalvia & Lu Chen & Nick Luettke & David Caputo & Mike Pellegrini


Multifamily Continued to Defy the Supply Shock, Office’s Vacancy Rate Broke Another Record, Retail Rents Drift Higher with Tight Supply, And Industrial Maintains Status Quo
The Federal Reserve’s battle against inflation continues to remain important as the prolonged economic soft landing endures. Three rate cuts by the FOMC throughout 2024 helped the commercial real estate (CRE) industry, but with annual inflation rate accelerating to 2.7% in November expectations of slower movement for future cuts have emerged. While uncertainties remain, preliminary Q4 data shows a continued trend from prior quarters and levels of resiliencies across the sectors.
- Multifamily sector continued to defy supply shock with 0.2% effective rent growth and 10 basis-point (bps) vacancy increase in the final quarter. As completions expected to slow down in 2025, we anticipate a declining vacancy rate and larger rent growth in the year ahead.
- The office sector’s vacancy rate continued its steady climb and finished the year at another record high of 20.4%. Despite headlines over RTO mandates, the widespread popularity of hybrid and remote work persists while pre-pandemic and early-pandemic leases continue to roll over.
- The retail sector’s vacancy rate held steady at 10.3% with effective rent grew by 0.3% in Q4. The sector’s constant evolution under intense competition from E-Commerce and change of retail experience was stabilized by constrained inventory growth.
- The industrial sector continued to stabilize in Q4 2024, reflecting its ongoing rebalance of supply and demand throughout the year, following stellar performances during the pandemic. While the vacancy rate observed a 10-bps dip to 6.9% for the quarter, it was up 50 bps year over year.
Multifamily
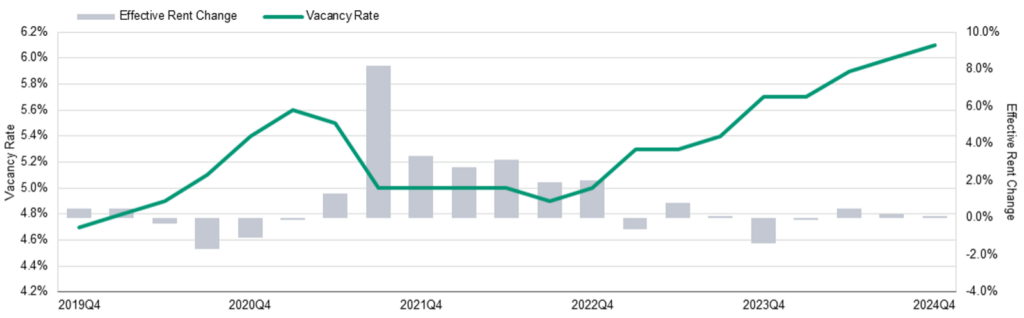
The national multifamily market delivered a balanced performance in the second half of the year. Nearly 290,000 units[1] were verified to complete across the 79 major metros for the year, with final completion expected to surpass the 300,000 mark as survey goes through the remainder projects in the next few weeks. Accounting for all 275 US metros, about 15% more units will be counted towards the total inventory growth in the nation. Amid record-level inventory growth, average vacancy rate edged up 10 bps in each of the last two quarters and finished 2024 at 6.1%, 40 bps higher than the same time last year and the highest level on record since 2011.
This rather controlled growth of vacancy rate was attributed to steady rental demand. According to the latest Census 2024 population vintage[2], the last two years featured significant population growth due to rapid recovery in immigration. Meanwhile, US GDP has been growing above its potential in recent quarters[3], supporting a stable labor market and steady wage growth. As the 30-year fixed mortgage rate remains close to 7%, the spread between the prevailing and average mortgage rate remained wide, keeping the single-family housing inventory unseasonably low and trade-up options for renters suppressed. With all factors considered, many renters chose to stay in the rental market which in turn balanced out the supply shock. Over the past 12 months, an average of nearly 500 more units are absorbed each month, when compared to its average over the 10 years preceding the COVID-Pandemic.
Strong rental demand and competitive new Class A multifamily completion have secured positive rent growth in the last three quarters. National asking rent ($1,850) registered another 0.2% growth in Q4 and nearly touched its all-time high at $1,851 recorded in Q3 2023. However, elevated vacancy rate led to longer lease-up time which encouraged concession. Effective rent growth slowed from 0.5% earlier this year to just 0.1% in Q4. At $1,757 in Q4, the national average effective rent remained $12 below its peak level.
Figure 1. Multifamily Rent and Vacancy Trend: Defying the Supply Shock
Source: Moody's
Office
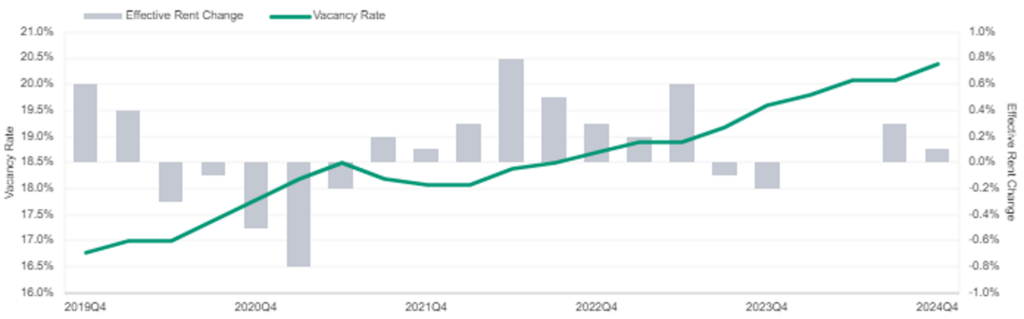
The national office vacancy rate hit a new record at 20.4% in Q4 2024, with average effective rents increasing by merely 0.1%. Over the course of 2024, the office sector has suffered a total of 80 bps of vacancy increase, with 30 bps registered in the final quarter. Five years since the adoption of the widespread hybrid and remote working models, a new regime is forming which has led to a permanent reduction in office demand. More flexible or shorter office leases meant pre-pandemic rollover has now fused with early-pandemic lease rollover throughout 2024, driving more volatilities in future office performance.
While Q4 2024 represents another down-performing year for the sector, the emerging trend of popular in-person working days and stabilizing return-to-office rate suggest firms may only be able to reduce their footprint to a certain extent before moving toward a new equilibrium. The success of newer buildings designed to maximize in-person collaboration with a reduced need for permanent offices and cubicles redefined the flight-to-quality story despite the overall struggle, though 17.5 million square feet (sqft) of new construction in 2024 remains below pre-pandemic levels.
Figure 2. Office Rent and Vacancy Trend: Space Market Stress Continues
Source: Moody's
Retail
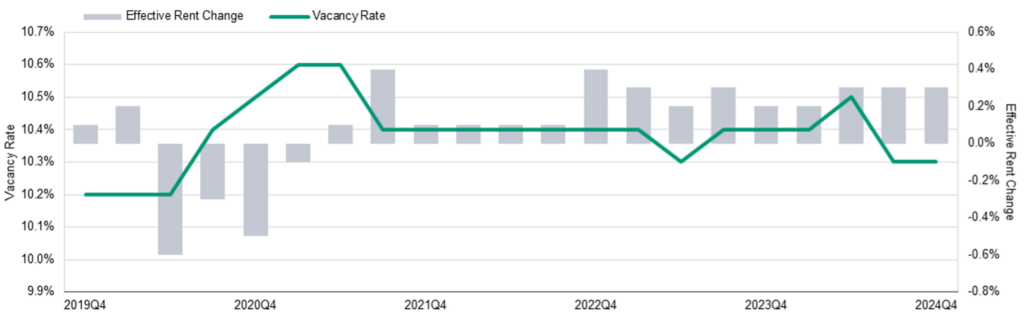
The retail vacancy rate remained stable at 10.3% in Q4, putting a pause to a one-time decline in the previous quarter. Both asking and effective rent enjoyed a slight increase of 0.3%, reaching $21.90 and $19.19/sqft respectively. This steady performance fit in with the backdrop of retail sales exceeding expectations again in the fourth quarter, with October and November witnessing 0.5% and 0.7% growth respectively. Although these gains were primarily driven by purchases of motor vehicles and online merchandise, this surge in consumer spending reflected the resilience of the labor market, robust household finances, accompanied by Federal Reserve interest rate cuts and a slowdown in inflation, which together bolstered consumer confidence.
The spending trends also carried over into the holiday shopping season, according to Mastercard's SpendingPulse survey. Physical stores saw notable activity, despite a significant portion of shopping occurring online and this year's holiday shopping season between Thanksgiving and Christmas being one week shorter than last year's. Between November 1 and December 24, in-store sales rose by 2.9% year-over-year, led by restaurant sales (+6.3%), jewelry (+4%), electronics (+3.7%), and apparel (+3.6%).
Figure 3. Retail Rent and Vacancy Trends: Vacancy Held Flat After a Brief Decline in Q3
Source: Moody's
Industrial (Warehouse/Distribution Center)
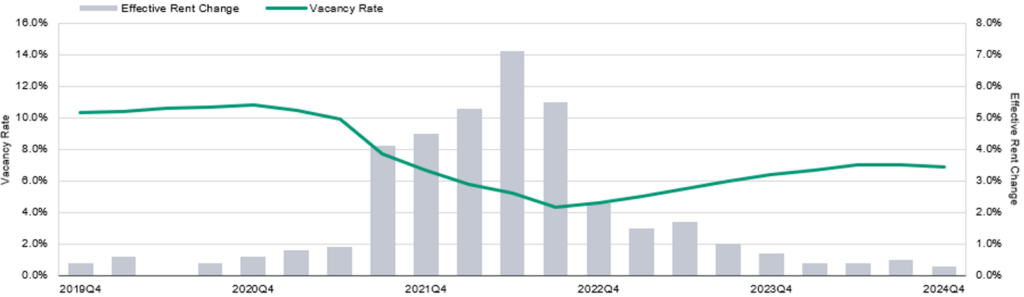
The industrial sector continued to stabilize in the final quarter, with vacancy rates decreased by 10 bps to 6.9%. Although the national vacancies have remained at or above 6.0% since Q3 2023, they remained well below pre-pandemic averages. As highlighted in previous reports, after years of robust growth, new construction starts have slowed, influenced by rising interest rates and softened demand. However, overall construction levels remain healthy. Moreover, a resurgence in construction activities on previously delayed or paused projects could lead to higher vacancy rates in the near horizon.
In the fourth quarter, both asking and effective rent grew by 0.3%. This marks a decline from the previous quarter, where asking and effective rents increased by 0.5% each. This quarterly change continued to extend the bell-shaped curve to its lowest point, especially when compared to its unprecedented growth over 2021 and 2022.
Figure 4. Industrial (Warehouse/Distribution Center) Rent and Vacancy Trends: Vacancy Continues to Stabilize
Source: Moody's
Table 1. Summary of Moody’s CRE Q4 2024 Statistics
Apartment Sector
| Performance Metrics | Q4 2024 | Q3 2024 | Q4 2023 | Quarterly Change (from Q3 2024) |
Annual Change (From Q4 2023) |
| Vacancy Rate | 6.1% | 6.0% | 5.7% | 0.1% | 0.4% |
| Asking Rent (per unit) | $1,850 | $1,847 | $1,837 | 0.2% | 0.7% |
| Effective Rent (per unit) | $1,757 | $1,755 | $1,744 | 0.1% | 0.7% |
Office Sector
| Performance Metrics | Q4 2024 | Q3 2024 | Q4 2023 | Quarterly Change (from Q3 2024) |
Annual Change (From Q4 2023) |
| Vacancy Rate | 20.4% | 20.1% | 19.6% | 0.3% | 0.8% |
| Asking Rent (per SF) | $35.88 | $35.81 | $35.55 | 0.2% | 0.9% |
| Effective Rent (per SF) | $28.31 | $28.27 | $28.19 | 0.1% | 0.4% |
Retail Sector
| Performance Metrics | Q4 2024 | Q3 2024 | Q4 2023 | Quarterly Change (from Q3 2024) |
Annual Change (From Q4 2023) |
| Vacancy Rate | 10.3% | 10.3% | 10.4% | 0.0% | -0.1% |
| Asking Rent (per SF) | $21.90 | $21.84 | $21.70 | 0.3% | 0.9% |
| Effective Rent (per SF) | $19.19 | $19.14 | $18.99 | 0.3% | 1.1% |
Industrial Sector
| Performance Metrics | Q4 2024 | Q3 2024 | Q4 2023 | Quarterly Change (from Q3 2024) |
Annual Change (From Q4 2023) |
| Vacancy Rate | 6.9% | 7.0% | 6.4% | -0.1% | 0.5% |
| Asking Rent (per SF) | $7.95 | $7.93 | $7.82 | 0.3% | 1.7% |
| Effective Rent (per Sf) | $7.59 | $7.57 | $7.47 | 0.7% | 1.6% |
Source: Moody’s
US Metros
For the 10 largest states measure by total multifamily inventory, North Carolina (+4.5%), Florida (+3.7%), Texas (+3.3%), New York (+2.0%) and New Jersey (+2.0%) all recorded at least 2% of inventory growth in 2024. Their rapid multifamily market expansion supported the dire need for each state’s fast-growing population, according to Census’ latest 2024 population estimates. California ranked number three on the Census’ list as the state accelerated the population gain in recent quarters. However, its multifamily inventory only grew by 0.8% year-over-year, due to longer construction timeline, lower economic return, and prior population losses.
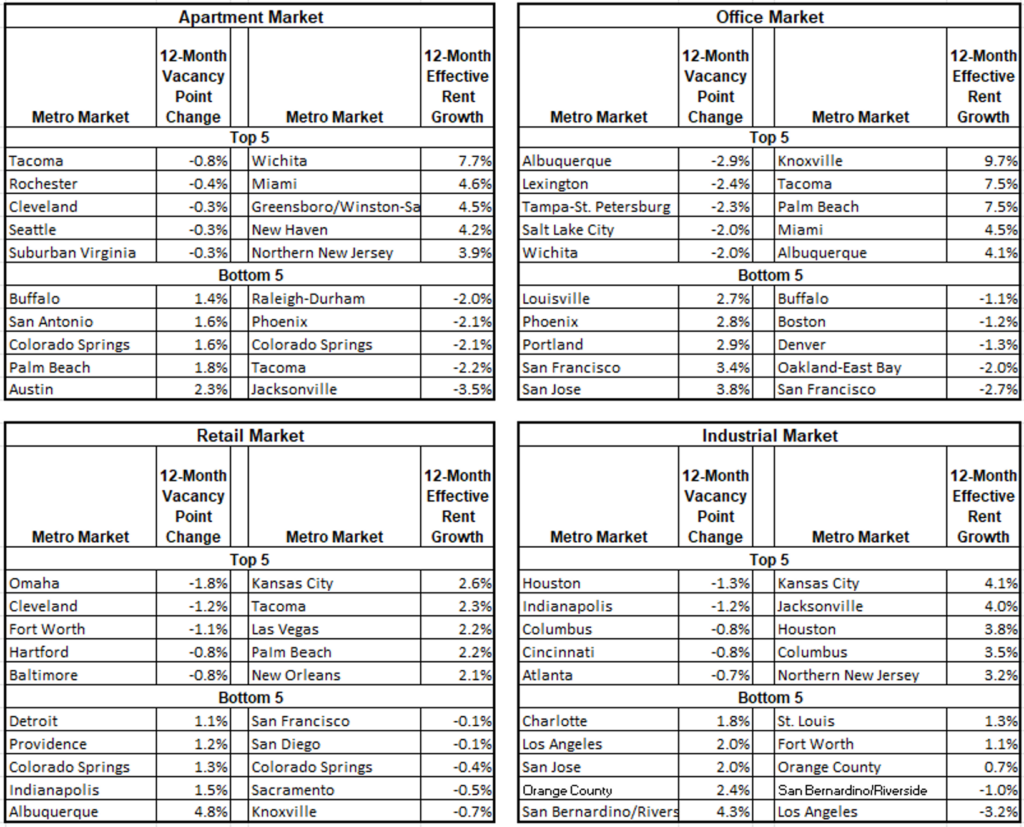
At the metro level, Charlotte (+5.3%), Nashville (+5.6%), Raleigh-Durham (+5.8%), Colorado Springs (+6.2%), Austin (+7.8%), and Portland (+9.5%) all enjoyed more than 5% of multifamily inventory growth this year. Austin continued to see the metro’s average vacancy rise over the 12-month period by a staggering 230 bps to 11.5%, the highest among all primary metros. The vacancy rates for Nashville (9.5%), San Antonio (9.3%) and Raleigh-Durham (9.1%) are also pressured by the supply shock, with their latest levels all hovering above 9%. Over half of all metros (43 of 79) experienced price gains in the last quarter. Miami (+2.3%) led the pack, thanks to its enduring appeal of lifestyle. Houston (+1.7%) was the only Texas primary metro that recorded positive rent growth in Q4, due to its stabilizing supply-demand dynamics compared to its other Texas counterparts.
For the office sector in Q4 2024, 48% (38 of 79) of metros observed a vacancy rate increase, with 11 of which experienced a rise of 100 bps or more. The largest Q4 2024 struggles were found in Portland (+2.2%), Denver (+1.7%), Chicago (+1.4%), Phoenix (+1.3%), and Baltimore (+1.2%). While the story of slow bleeding continues at the national level, some metros have recorded better office performances. Year over year, four of the top five metros with the largest positive net absorption were found in the Sun Belt, as Atlanta (1.4 million sqft), Tampa-St. Petersburg (1.0 million sqft), Northern New Jersey (825,000 sqft), Miami (773,000 sqft), and Houston (744,000 sqft) leading the pack. On the opposite end, five of the top six metro’s which have experienced the largest vacancy rises in 2024 were found in the Western region, with San Jose (+3.8%), San Francisco (+3.4%), Portland (+2.9%), Phoenix (+2.8%), Louisville (+2.7%), and Denver (+2.7%) lagging the most.
Retail vacancies declined or remained flat in more than half of (47 out of 80) primary metros in Q4, but the changes were mostly moderate and stable, aligned with the national trend. Retail vacancy changes ranged from –50 bps in Fort Worth to +160 bps in Westchester, while 84% of (67 of 80) primary metros observed a shift less than 40 bps. Over the past 12 months, the top performing retail markets on the vacancy side included Omaha (-180 bps), Cleveland (-120 bps), Fort Worth (-110 bps), Baltimore (-80 bps), and Hartford (-80 bps), while Albuquerque (+480 bps), Indianapolis (+150 bps), Colorado Springs (+130 bps), Providence (+120 bps) and Detroit (+110 bps) experienced the sharpest vacancy rises. Seventy-four of 80 primary markets recorded positive effective rent growth compared to a year ago, but Knoxville (-0.7%), Sacramento (-0.5%), Colorado Springs (-0.4%) San Diego (-0.1%) and San Francisco (-0.1%) suffered declines.
*These retail statistics represent neighborhood and community shopping centers only. Moody’s does not report mall rents at the metro level.
In the industrial sector, San Bernardino/Riverside led the total completions for the fourth quarter, adding 1.7 million sqft, followed by Philadelphia with 1.2 million sqft. Phoenix also continued its strong construction performance in the final months of the year, finishing in the top five for the quarter. 17% (8 out of 47) of the primary metros experienced negative absorption in the fourth quarter, with San Bernardino/Riverside leading the decline (-2.7 million square feet). The volume of new supplies that has come online in the metro may have led to an overabundance. On a year-over-year basis, slightly more than half of the metros (25 out of 47) saw an increase in vacancy rates. The most significant increases were observed on the West Coast, with San Bernardino/Riverside (+430 bps), Orange County (+240 bps), and San Jose (+200 bps) and Los Angeles (+200 bps) all experiencing at least 200 bps of jump.
Table 2: Annual Effective Rent Growth and Vacancy Changes: Top 5 and Bottom 5 Metros
Source: Moody's
Conclusion
2024 marks a year with transitions, resiliencies, and hopes, while the commercial real estate sectors continued to search for new equilibrium. Office sector had a bumpy ride, but it is also proven not to be all doom and gloom, especially with the success story varies at the microlevel. Multifamily’s rising vacancies don’t have to be a sign of weakness. Temporary imbalance between supply and demand requires more patience for a rebound. Industrial’s legacy has a long-lasting effect, even though the headline figures may not fully reveal the pivot of demand and continued bet on the sector’s future. The retail sector thrives on the steady economy and strong consumer spending, but it is also building out resiliency under the constant changing retail experience and preference.
There are always uncertainties and risks ahead, but it is astonishing to see a new era emerging, defined by more extensive collaborations among commercial sectors to break barriers and recreate live-work-play communities. It is intriguing to see more support from the public sectors, and lower capital cost brings more investment interests and lending opportunities. Undoubtedly, there will be pains and bumps but creative value-add and smart pivot should help with commercial real estate’s long-term prosperity.
Note: Information in this report is based on preliminary Q4 2024 data believed to be accurate as of the date of publishing and is subject to change prior to the finalization on February 1, 2025.
[1] Our data only covers multifamily properties with at least 40 units (or 20 units in California and Arizona).
[2] https://www.census.gov/data/tables/time-series/demo/popest/2020s-national-total.html#v2024
[3] https://www.bea.gov/data/gdp/gross-domestic-product
Thomas P LaSalvia, Ph.D. is Head of Commercial Real Estate Economics at Moody's Analytics specializing in commercial real estate across property types. While his expertise encompasses space and capital market performance, Thomas’s keen interest lies within the subdiscipline of optimal location theory. Dr. LaSalvia regularly presents his research at industry events and his insights are frequently featured in leading periodicals. Prior to joining Moody's Analytics, Dr. LaSalvia was an industry consultant and served as a Lecturer of Economics at The College of William & Mary.
Lu Chen is a Senior Economist at Moody's Analytics. She has worked in the commercial real estate industry for over a decade. Lu has deep knowledge in urban economics and credit risk models, with special focus on metro/regional CRE market performance, housing affordability and affordable housing, senior housing, and urban migration. Lu’s insights have featured in leading industry and national publications, including The New York Times, Bloomberg, Yahoo Finance, Axios, The Hill, and Scotsman Guide.
Nick Luettke is an Associate Economist specializing in policy issues related to commercial real estate such as affordable housing, ESG, and downtown office utilization. Nick’s interested in learning how actors across governmental institutions respond to important societal questions concerning commercial real estate. Additionally, Nick analyzes how corporations choose their headquarters and the relationship local governments have with key stakeholders in their community. Nick holds an M.Sc. in Politics, Economics, and Philosophy from Universität Hamburg and an M.A. in Political Science from the George Washington University.
David Caputo is a Data Scientist at Moody’s Analytics.
Mike Pellegrini is an Associate Economist at Moody's Analytics.
Need Expert Guidance in Retail Investment Sales?
Whether you're acquiring, repositioning, or exchanging assets, our advisors deliver strategic insight, responsive communication, and proven results at every stage.
 Sign
in
with Facebook
 Sign
up
with Google